Why marginal abatement cost (MAC) curves aren’t the right answer
Posted February 2025
CEO
When businesses look to reduce their carbon emissions they often turn to something called Marginal Abatement Cost (MAC) curves. These are graphs that promise to show the cheapest ways to cut down on carbon and then move toward the pricier options.
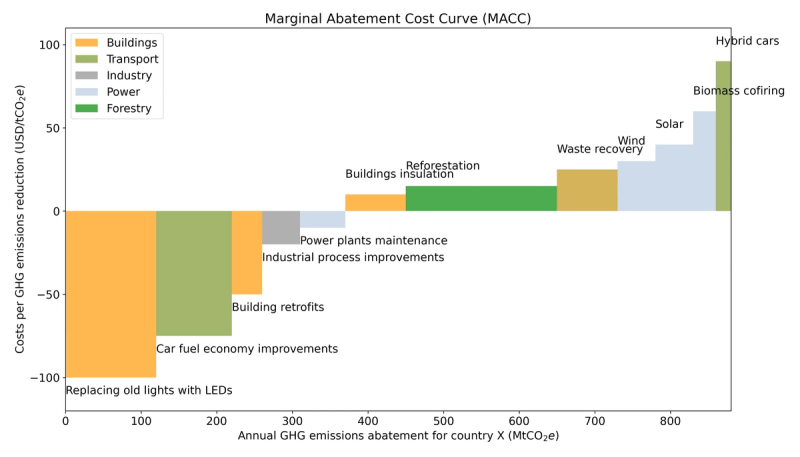
It sounds like a smart, straightforward plan: start with the low-hanging fruit and then tackle the harder stuff. But here's the catch: these graphs are a snapshot, only showing what things look like today.
Think of it this way: if you're planning a trip around the world that will take a whole year, checking today's traffic won't tell you much about the traffic you'll face in six months. MAC curves are similar; they might point out where you can save money and cut emissions now, but they don’t show how those savings could change over time.
It's like trying to plan your entire year's budget based on what you spend in January alone. You wouldn't do that, right? Because you know prices change, unexpected expenses pop up, and what seems like a bargain now might not be in the future.
MAC curves do a great job of getting us thinking about costs and what we can do right now. But when it comes to building a long-term plan to reduce carbon emissions affordably and effectively, we need to think about timing. That's where time-specific optimization solutions come in – think of these as super-smart schedules that not only tell you what to do but when to do it to save the most money and make the biggest carbon cuts.
Our team has been working on this because we know it works. This method is like having a GPS for your business's journey to being greener, guiding you turn by turn and adjusting the route as conditions change. It's been a game-changer in lots of industries, and now we're bringing it to help companies everywhere go green in the smartest way possible.